
How wOBA Overlooks the True Value of Specific Outcomes
In my last post, I discussed the drawbacks of weighted on-base average (wOBA) and how its biases seep into other popular metrics like xwOBA, xERA, wRC+, and even some stuff quality models. The basis of my argument was that wOBA takes an oversimplified approach to weighting different outcomes. Specifically, it weights all outs equally, leading to an undervaluing of ground balls and double plays. I showed that there is a fundamental bias in how wOBA is calculated, but that doesn’t mean much unless I show you the magnitude of that bias which is what I’m going to do today.
Understanding wOBA and Its Shortcomings
The nice thing about wOBA is that it has a relatively simple formula–it’s not too hard to calculate, and it does a decent job at predicting run production. But with simplicity comes tradeoffs and biases, and unfortunately these biases aren’t evenly distributed to different batter and pitcher skillsets. In baseball, there are many different outcomes and weighting each and every one of them accurately requires very granular data and precise calculations. wOBA takes on the idea of run values, weighting plays by their average effect on scoring and then rescaling the metric to look like on-base percentage (OBP). The problem is that wOBA only weights outcomes like walks, hit by pitches, and hits. When you look at all the different possible outcomes a hitter can have, there are a lot more that have large effects on run scoring. Here are the run values from 2022 for each possible outcome (excluding triple plays).
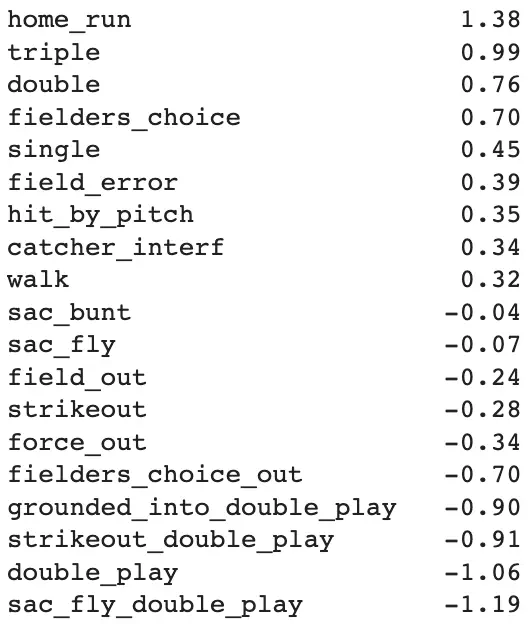
As you can see, outs are not all created equal. Sacrifice bunts and sacrifice flies are net negative outcomes, but they’re still better than a regular out. Additionally, double plays save over three times the amount of runs that a regular out does. What kind of pitcher avoids sacrifice flies and gets a lot of double plays? If you haven’t already guessed it’s a ground ball pitcher. With wOBA, two of the main strengths of a ground ball pitcher get overlooked.
Delving into xwOBA and Groundballs
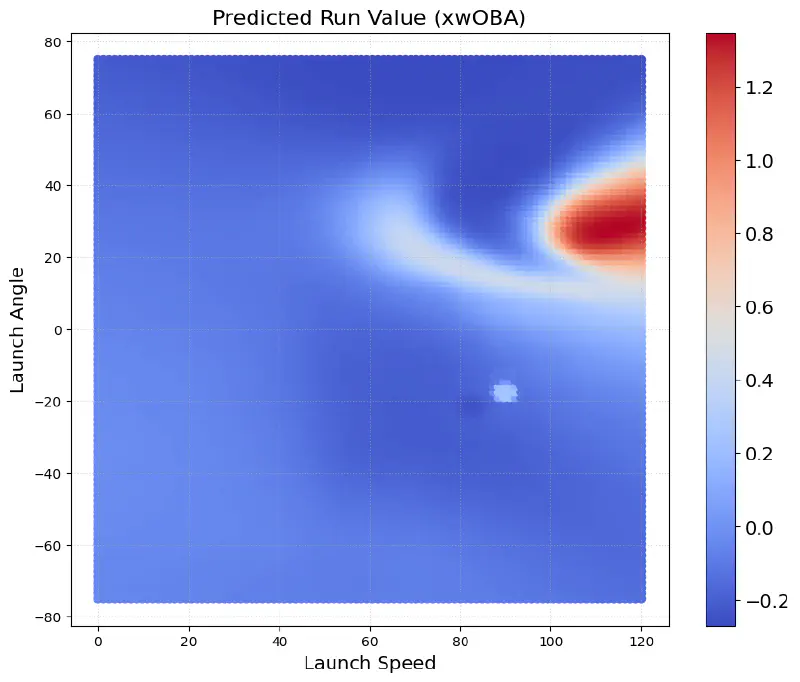
Let’s go a step further by looking at expected wOBA (xwOBA). If you aren’t familiar, xwOBA is a metric that predicts the wOBA value of a batted ball based on the average from buckets of similar batted balls based on launch angle and exit velocity. This is done using a model called K-Nearest Neighbors (KNN), which does exactly what it sounds like it does (it looks at the K number of data points that are most similar and predicts wOBA as the average wOBA of those data points). I ran this model with a K of 5,000 on a dataset of nearly 1.4 million batted balls from the statcast era (dating back to 2015). Here’s how xwOBA is influenced by exit velocity and launch angle. I’ve rescaled it to reflect the actual run values using the process described here. If you look at the prominent red blob on the right, you’ll see the range of exit velocities and launch angles where home runs occur.
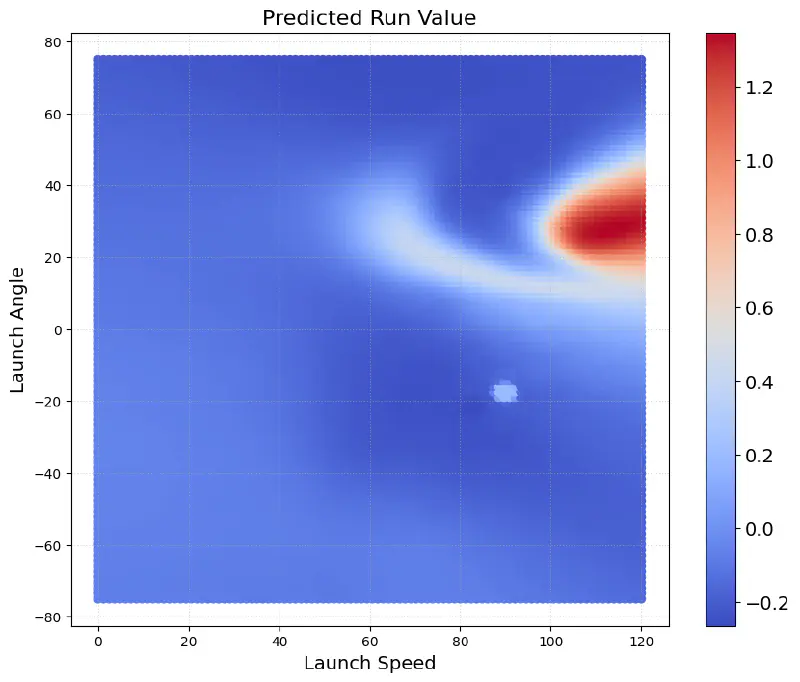
Now, the next plot isn’t going to look that much different but it is–I promise. Instead of predicting wOBA I predicted the actual run values of each outcome, like the numbers I showed above. So this is what run value by exit velocity and launch angle looks like when we factor in all possible hitter outcomes.
It looks exactly the same at first. But if you take the difference between the two types of run values, the biases of xwOBA become much more apparent:
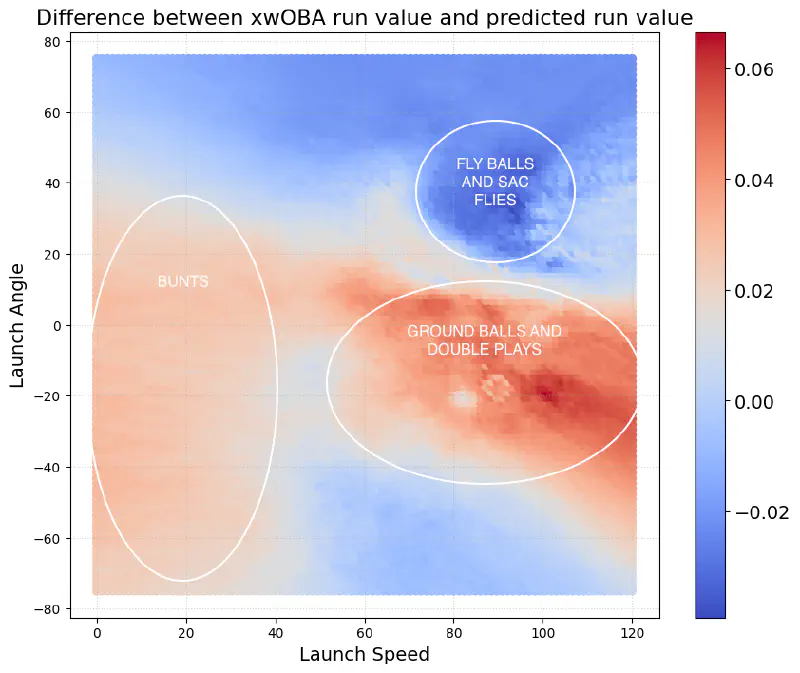
As you can see, batted balls in the ground ball range of exit velocities and launch angles are overvalued by wOBA by about 0.05 runs. This may not seem like a lot, but when you consider that your regular qualified starting pitcher has about 500 balls in play over the course of a full season, it quickly begins to add up. Similarly, groundball pitchers work to keep the ball out of the air, thereby limiting sacrifice flies. This strategy becomes even more valuable considering that wOBA undervalues the importance of fly balls within this category of batted balls, which makes ground balls more valuable in comparison.
Last and probably least, the value of a bunt improves slightly. I think it’s pretty amusing that some of the trends away from “small ball”–good up-the-middle defense, keeping the ball in the infield, and less bunting can be attributed to using wOBA and wRC+ (a rescaled and park and era-adjusted version of wOBA) as our primary stats to measure offense in recent years.
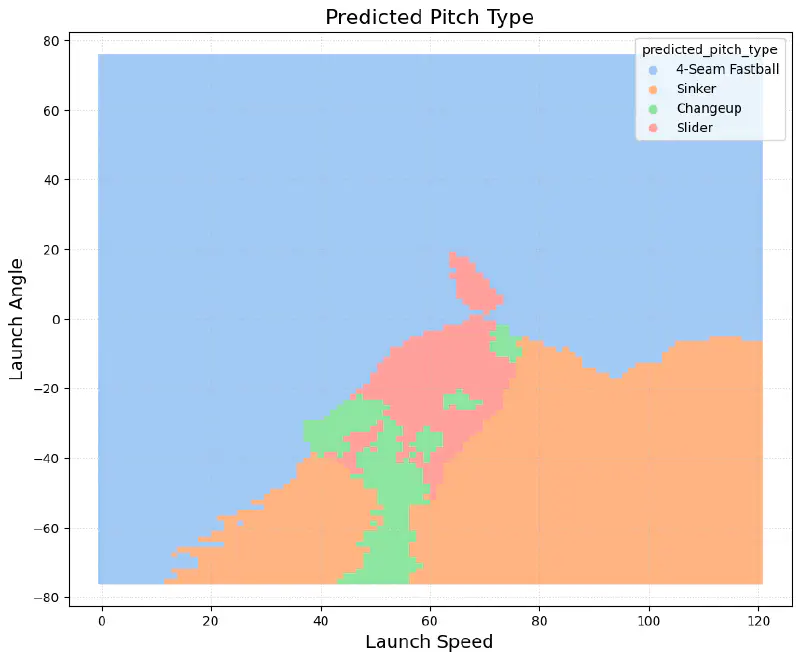
Taking the same nearest-neighbor approach and using it to predict the most likely pitch type based on exit velocity and launch angle yields another interesting visualization. Sinkers are the most common pitch type in the bucket of exit velocities and launch angles that wOBA undervalues most. This makes intuitive sense because a good sinker is a hard pitch to hit in the air and it is a weapon often leaned on by pitchers looking to induce a double play.
So there you have it. Now we understand why OPS, a stat that combines two different metrics–OBP and SLG–with completely different denominators, is still roughly equivalent to wOBA in its effectiveness at predicting runs scored.
Towards a New Metric and Conclusion
In my next article, I will introduce a new version of xERA that accounts for the biases present in xwOBA. I’ve always felt like xERA should perform like a more accurate version of FIP, and with these improvements I think we will get there.
As a little preview, here are this year’s leaders of predicted run value (per batter faced, min. 100IP).
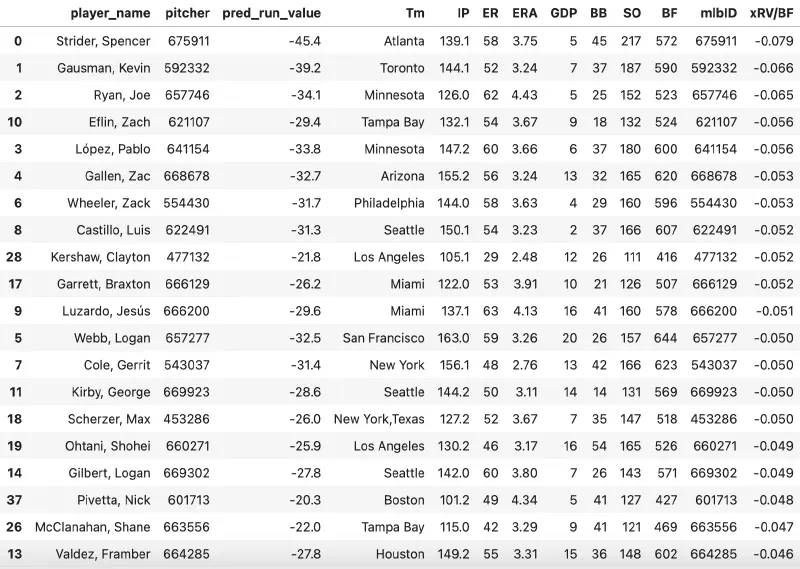
There’s still some work to be done in order to convert it to an ERA scale, but I like the results so far. Compared to xERA, there are some noticeable changes. Kevin Gausman moves from 24th to 2nd, Zac Gallen moves from 37th to 6th, and Marlins sinker-baller Braxton Garrett moves from 70th all the way to 10th.
So, what’s the takeaway from all this digging into wOBA and xwOBA? They’re useful stats, but they’ve got some correctable blind spots, especially when it comes to ground balls and double plays. If you’re trying to get the full picture of a player’s skills, these metrics might not give you everything you need. Baseball is a complex game, and capturing all of its intricacies in a single number is a tall task.